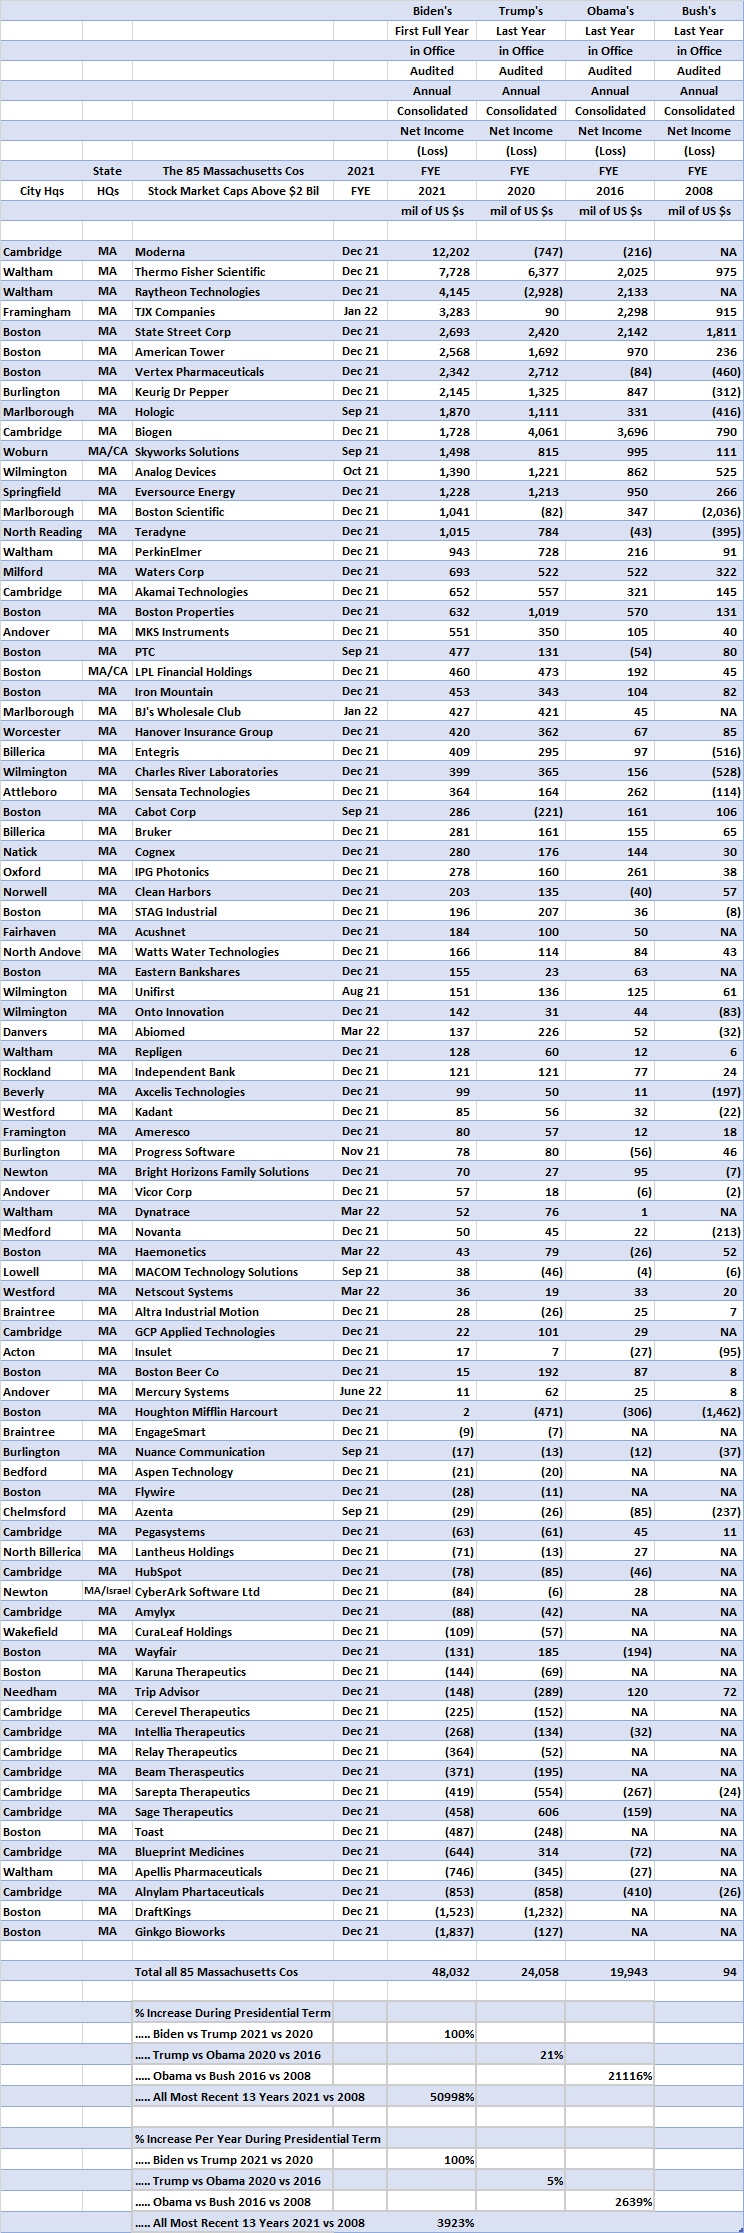
These Largest 85 Massachusetts Cos (Stock Market Caps Above $2 Bil) Saw Their Total Audited Annual Earnings Improve By a Blistering 100% in Annual 2021 From Annual 2020, in the Biden Admin's First Full Year in Office.
Then During the 4 Years of the Trump Admin, These Largest Massachusetts Cos Experienced a Total Annual Earnings Increase of 21% or By 5% Per Year.
And During the Obama/Biden Admin's Eight Years in Office, These Largest Massachusetts Cos Had a Total Annual Earnings Increase of an Amazing 21,116% or of a Spectacular Average Annual Increase of 2,639% Per Year.
From a review of companiesmarketcap.com, of valuetoday.com, of the Google Finance website, of the investing.com website, of the yahoo finance website, and a particularly extensive review of Company SEC filings, there were 85 Massachusetts Companies with stock markets caps above $2 bil recently.
I excluded from the above 85 Companies the large trading Closed-end Funds. Nearly all of the Trading Closed-end Funds in existence in 2008 had just horrific operating results in the financial meltdown year of 2008. Later, when I get some time, I'll make a post which will show just how large many of their losses were in 2008.
Also, GE was headquartered in Connecticut for the majority of the 13 years from 2008 to 2021 and thus was not included in the below Massachusetts Companies' table. Further, given the horrible financial climate in 2008, I have a lot of trouble understanding how GE, which in 2008 was in essence mostly a financial giant, could possibly report such strong earnings in 2008.
And from Company financial statements contained in the SEC website, the table below shows the Audited Gold-Standard US GAAP Consolidated Net Income (Loss) from Continuing Operations for each of these 85 largest Massachusetts Companies for 2021, the Biden Administration's first year in office, for 2020, the Trump Administration's last year in office, for 2016, the Obama Administration's last year in office and for 2008, the Bush Administration's last year in office.