Friday, April 29, 2022

The 54 Largest Companies in The Netherlands Reporting in EUROs Generated Total Bottom-Line Earnings in Fiscal Year 2021 Which Increased By an Incredible 92% From That in the Pre-Covid Pandemic Fiscal Year of 2019. The 8 Companies in The Netherlands Reporting in US$s Generated Total Bottom-Line Earnings in Fiscal Year 2021 Which Increased By an Even More Incredible 166% From That in the Pre-Covid Pandemic Fiscal Year of 2019.

From a review of companiesmarketcap.com, of topforeignstocks.com, of the Google Finance and Yahoo Finance websites, and of the Euronext Amsterdam, there were 54 Netherlands' Companies with stock market caps above US$1 bil recently, which had their Income Statement information included in the WSJ Markets website including their Consolidated Net Income (Loss) for each of the most recent three fiscal years 2021, 2020 and 2019, and which also reported their earnings information in EUROs.  Several of these Companies Earnings were derived from these Companies' actual financial statements.  

And there were 8 additional Netherlands' Companies which reported their earnings results in US$s. 

From predominately their Income Statement summaries reported in the WSJ Markets website, the first table below shows the Consolidated Net Income (Loss) from continuing operations for fiscal years 2021, 2020 and 2019 for each of these 54 largest Netherlands' Companies reporting in EUROs. 

The second table below showed the same information for each of the 8 additional Netherlands' Companies reporting in US$s.  This information was derived from these Companies financial statements filed with the US SEC.


Thursday, April 28, 2022

The 29 Largest Swiss Cos With Stock Market Caps Above US$10 Bil Generated Total 2021 Bottom-Line Earnings Which Were Up Sharply By 43% From the Pre-Covid Pandemic Year of 2019, While the 81 Smaller Swiss Cos With Stock Market Caps of US$1-10 Bil Saw Their Same 2021 Total Earnings Decrease By 17% From That in 2019. The 29 Largest Swiss Cos Had 2021 Total Earnings Which Increased By an Outstanding 128% From That in 2017, While the 81 Smaller Swiss Cos' 2021 Total Earnings Increased By a Substantially Lower 13% From That in 2017.

From a review of topforeignstocks.com, the Google Finance and Yahoo Finance websites, and the Swiss Stock Exchange Company Components of its SPI Index , there were 110 Swiss Companies with stock market caps above US$1 bil recently, which had their Income Statement information included in the WSJ Markets website including their Consolidated Net Income (Loss) for each of the most recent five fiscal years 2021, 2020 and 2019, 2018 and 2017, and which also reported their earnings information in Swiss Francs (CHFs).  

From their Income Statement summaries reported in the WSJ Markets website, the table below shows the Consolidated Net Income (Loss) from continuing operations for fiscal years 2021, 2020, 2019, 2018 and 2017 for each of these 110 largest Swiss Companies. 


The 110 Largest Swiss Companies Reporting in Swiss Francs Generated Total Bottom-Line Earnings in Fiscal Year 2021 Which Increased By an Excellent 31% From That in the Pre-Covid Pandemic Fiscal Year of 2019, By an Impressive 45% From That in Fiscal Year 2018 and By an Outstanding 103% From That in 2017. The 8 Largest Swiss Companies Reporting in US Dollars Reported Total Bottom-Line Profits in 2021 Which Increased By an Off-the-Charts 1,571% From That in 2020 and By an Incredible 210% From That in the Pre-Covid Pandemic Year of 2019.

From a review of topforeignstocks.com, the Google Finance and Yahoo Finance websites, and the Swiss Stock Exchange Company Components of its SPI Index , there were 110 Swiss Companies with stock market caps above US$1 bil recently, which had their Income Statement information included in the WSJ Markets website including their Consolidated Net Income (Loss) for each of the most recent five fiscal years 2021, 2020 and 2019, 2018 and 2017, and which also reported their earnings information in Swiss Francs (CHFs).  

And there were 8 additional Swiss Companies which reported their earnings results in US$s. 

From their Income Statement summaries reported in the WSJ Markets website, the first table below shows the Consolidated Net Income (Loss) from continuing operations for fiscal years 2021, 2020, 2019, 2018 and 2017 for each of these 110 largest Swiss Companies. 

The second table below showed the same information for each of the 8 additional Swiss Companies reporting in US$s.  This information was derived from the Companies financial statements filed with the US SEC.


Tuesday, April 26, 2022

The 17 Companies in Iceland Generated Total Bottom-Line Earnings in Fiscal Year 2021 Which Increased By an Off-the-Charts 124% From That in the Pre-Covid Pandemic Fiscal Year of 2019.

From a review of topforeignstocks.com, of the Google Finance and the Yahoo Finance websites, and of Wikipedia, I found 19 Icelandic Companies which had their Income Statement information included in the WSJ Markets website including their Consolidated Net Income (Loss) for each of the most recent five fiscal years 2021, 2020, 2019, 2018 and 2017.  Seventeen of these 19 Companies reported their earnings information in Icelandic Kronas (ISKs).

From their Income Statement summaries reported in the WSJ Markets website, the table below shows the Consolidated Net Income (Loss) from continuing operations for fiscal years 2021, 2020, 2019, 2018 and 2017 for each of these 17 Icelandic Companies.


The 41 Largest Companies in Denmark Generated Total Bottom-Line Earnings in Fiscal Year 2021 Which Increased By an Off-the-Charts 109% From That in the Pre-Covid Pandemic Fiscal Year of 2019.

From a review of companiesmarketcaps.com, of topforeignstocks.com, and of the Google Finance and of the Yahoo Finance websites, there were 41 Danish Companies with stock market caps above US$1 bil recently, which had their Income Statement information included in the WSJ Markets website including their Consolidated Net Income (Loss) for each of the most recent five fiscal years 2021, 2020, 2019, 2018 and 2017, and which also reported their earnings information in Danish Kroner (DKKs).

From their Income Statement summaries reported in the WSJ Markets website, the table below shows the Consolidated Net Income (Loss) from continuing operations for fiscal years 2021, 2020, 2019, 2018 and 2017 for each of these 41 largest Danish Companies.  TDC Group's income statement information came from their financial statements contained in TDC Group's Investor Relations website.


Monday, April 25, 2022

The 20 Largest Companies in Poland Generated Total Bottom-Line Earnings in Fiscal Year 2021 Which Increased By a Spectacular 212% From That in Fiscal Year 2020, and Which Also Increased By an Almost Unbelievable 103% From That in the Pre-Covid Pandemic Fiscal Year of 2019.

From a review of companiesmarketcaps.com, of the Poland WIG-20 Index Components included in topforeignstocks.com, of the Google Finance and the Yahoo Finance websites, there were 20 Polish Companies with stock market caps above US$1 bil recently, which had their Income Statement information included in the WSJ Markets website including their Consolidated Net Income (Loss) for each of the most recent three fiscal years 2021, 2020 and 2019, and which also reported their earnings information in Polish Zlotys (PLNs).

From their Income Statement summaries reported in the WSJ Markets website, the table below shows the Consolidated Net Income (Loss) from continuing operations for fiscal years 2021, 2020 and 2019 for each of these 20 largest Polish Companies.


Sunday, April 24, 2022

The 45 Largest German Cos With Stock Market Caps > US$10 Bil Generated Total 2021 Bottom-Line Earnings Which Were Up By a Blistering 78% From the Pre-Covid Pandemic Year of 2019, While the 106 Smaller German Cos With Stock Market Caps of US$1-10 Bil Saw Their Same 2021 Earnings Increase By a Miniscule 1% From That in 2019.

From a review of topforeignstocks.com, the Google Finance and the Yahoo Finance websites, there were 151 German Companies with stock market caps above US$1 bil recently, which had their Income Statement information included in the WSJ Markets website including their Consolidated Net Income (Loss) for each of the most recent three fiscal years 2021, 2020 and 2019, and which also reported their earnings information in EUROs.

From their Income Statement summaries reported in the WSJ Markets website, the table below shows the Consolidated Net Income (Loss) from continuing operations for fiscal years 2021, 2020 and 2019 for each of these 151 German Companies.


Saturday, April 23, 2022

The 108 Smaller Companies in the UK Generated Total Bottom-Line Earnings Which Have Gone Down the Tubes, With Fiscal Year 2021 vs 2019 Down By 28%, 2021 vs 2018 Down By 44%, and With 2021 vs 2017 Down By 43%. The UK Has Clearly Turned From Being a Democracy To Now Being a Corpocracy, Just Like France, Germany and the US Has.

From a review of topforeignstocks.com, the Google Finance and the Yahoo Finance websites, there were 108 United Kingdom Companies with stock market caps of US$1-10 bil recently, which had their Income Statement information included in the WSJ Markets website including their Consolidated Net Income (Loss) for each of the most recent five fiscal years 2021, 2020, 2019, 2018 and 2017 and which also reported their earnings information in Great Britain Pounds (GBPs).

From their Income Statement summaries reported in the WSJ Markets website, the table below shows the Consolidated Net Income (Loss) from continuing operations for fiscal years 2021, 2020, 2019, 2018 and 2017 for each of these 108 smaller UK Companies. 


Friday, April 22, 2022

The 45 Largest Companies in the UK Generated Total Bottom-Line Earnings in Fiscal Year 2021 Which Increased By a Blistering 135% From That in Fiscal Year 2020, and Which Also Increased By a Very Impressive 51% From That in the Pre-Covid Pandemic Fiscal Year of 2019.

From a review of topforeignstocks.com, the Google Finance and the Yahoo Finance websites, there were 45 United Kingdom Companies with stock market caps above US$10 bil recently, which had their Income Statement information included in the WSJ Markets website including their Consolidated Net Income (Loss) for each of the most recent three fiscal years 2021, 2020 and 2019, and which also reported their earnings information in Great Britain Pounds (GBPs).

From their Income Statement summaries reported in the WSJ Markets website, the table below shows the Consolidated Net Income (Loss) from continuing operations for fiscal years 2021, 2020 and 2019 for each of these 45 largest UK Companies.


Thursday, April 21, 2022

The 24 Largest Companies in Norway Generated Total Bottom-Line Earnings in Fiscal Year 2021 Which Increased By a Completely Off-the-Charts 2,711% From That in Fiscal Year 2020, and Which Also Increased By an Incredible 66% From That in the Pre-Covid Pandemic Fiscal Year of 2019.

From a review of topforeignstocks.com, the Google Finance and the Yahoo Finance websites, there were 24 Norwegian Companies with stock market caps above US$1 bil recently, which had their Income Statement information included in the WSJ Markets website including their Consolidated Net Income (Loss) for each of the most recent three fiscal years 2021, 2020 and 2019, and which also reported their earnings information in Norwegian Krones (NOKs).

From their Income Statement summaries reported in the WSJ Markets website, the table below shows the Consolidated Net Income (Loss) from continuing operations for fiscal years 2021, 2020 and 2019 for each of these 24 largest Norwegian Companies.


Wednesday, April 20, 2022

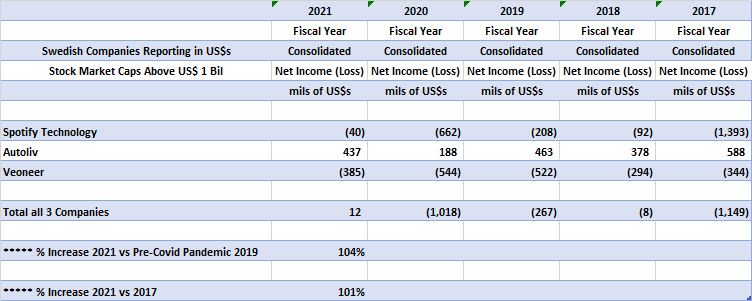
The 113 Largest Companies in Sweden Generated Total Bottom-Line Earnings in Fiscal Year 2021 Which Increased By a Blistering 106% From That in Fiscal Year 2020, Which Increased By an Impressive 39% From That in the Pre-Covid Pandemic Fiscal Year of 2019, and Which Also Increased by a Very Impressive 112% From That in Fiscal Year 2017.

From a review of companiesmarketcap.com, topforeignstocks.com, and the Google Finance website, there were 113 Swedish Companies with stock market caps above US$1 bil recently, which had their Income Statement information included in the WSJ Markets website including their Consolidated Net Income (Loss) for each of the most recent five fiscal years 2021, 2020 and 2019, 2018 and 2017, and which also reported their earnings information in Swedish Kronas (SEKs).

From their Income Statement summaries reported in the WSJ Markets website, the table below shows the Consolidated Net Income (Loss) from continuing operations for fiscal years 2021, 2020, 2019, 2018 and 2017 for each of these 113 largest Swedish Companies.  ICA Gruppen's Income Statement amounts in SEKs were from its financial statements contained in its Company's Investor Relations website.


Also from their Income Statement summaries reported in the WSJ Markets website or from their financial statements filed with the US SEC, the table below shows the Consolidated Net Income (Loss) from continuing operations for fiscal years 2021, 2020, 2019, 2018 and 2017 for each of the three Swedish Companies with stock market caps above US$1 bil which reported their financial statements in US$s. 


Monday, April 18, 2022

The 46 French Cos With Stock Market Caps > US$10 Bil Generated Total 2021 Bottom-Line Earnings Which Were Up By 23% From 2019, Up By 46% From 2018 and Up By 37% From 2017, While the 47 French Cos With Stock Market Caps of US$1-10 Bil Generated Total 2021 Bottom-Line Earnings Which Were Down By 20% From 2019, Down By 35% From 2018 and Down By 50% From 2017.

From a review of companiesmarketcap.com, there were 93 French Companies with stock market caps above US$1 bil, and which had their Income Statement information included in the WSJ Markets website including their Consolidated Net Income (Loss) for each of the most recent five fiscal years 2021, 2020 and 2019, 2018 and 2017 and which also reported their earnings information in EURO's.

From their Income Statement summaries reported in the WSJ Markets website, the table below shows the Consolidated Net Income (Loss) from continuing operations for fiscal years 2021, 2020, 2019, 2018 and 2017 for each of these 93 largest French Companies.  Constellium's Income Statement amounts in EUROs were from its US SEC 20-F Annual Report filings.


Sunday, April 17, 2022

The 50 Russian Companies, With Their Stock Trading on the Moscow Exchange and Having Reported Their FYE 2021 Annual Earnings in Russia Rubles by April 16, 2022, Posted Total Annual Bottom-Line Earnings of Russian Rubles 7.2 Trillion in Annual FYE 2021, an Increase of 34% From That in FYE 2019.

From their financial statements in their 20-F Annual Reports filed with the US SEC or in their financial statements included in their Company's Investor Relations website, or from their Income Statement summaries reported in the WSJ Markets website or in the yahoo finance website, the table below shows the Consolidated Net Income (Loss) from continuing operations for annual fiscal years ended 2021, 2020 and 2019 for each of the 50 Russian Companies which have their stock trading on the Moscow Exchange and which have reported their Annual FYE 2021 Earnings by April 16, 2022.


Saturday, April 16, 2022

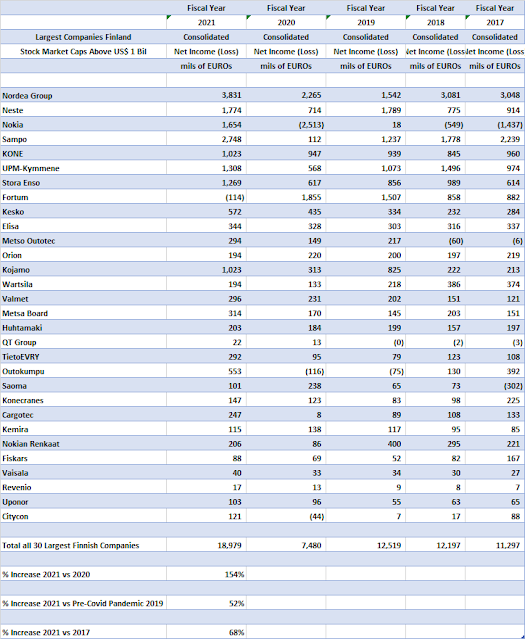
The 30 Largest Companies in Finland Generated Total Bottom-Line Earnings in Fiscal Year 2021 Which Increased By a Blistering 154%% From That in Fiscal Year 2020, and Which Increased By an Incredible 52% From That in the Pre-Covid Pandemic Fiscal Year of 2019, and Also Which Increased by an Impressive 68% From That in Fiscal Year 2017.

From a review of companiesmarketcap.com, there were 30 Companies in Finland with stock market caps above US$1 bil.

From their Income Statement summaries reported in the WSJ Markets website, the table below shows the Consolidated Net Income (Loss) from continuing operations for the most recent five fiscal years 2021, 2020, 2019, 2018 and 2017 for each of these 30 largest Finnish Companies.  Nordea Group's Income Statement amounts in EUROs were from its financial statements in its Investor Relations website.


Friday, April 15, 2022

The 125 Largest German Companies Generated Total Bottom-Line Earnings in Fiscal Year 2021 Which Increased By an Incredible 281% From That in Fiscal Year 2020, and Which Increased By an Even More Incredible 67% From That in the Pre-Covid Pandemic Fiscal Year of 2019.

From a review of companiesmarketcap.com, there were 125 German Companies with stock market caps above US$1 bil, and which had their Income Statement information included in the WSJ Markets website including their Consolidated Net Income (Loss) for each of the most recent three fiscal years 2021, 2020 and 2019, and which also reported their earnings information in EURO's.

From their Income Statement summaries reported in the WSJ Markets website, the table below shows the Consolidated Net Income (Loss) from continuing operations for fiscal years 2021, 2020 and 2019 for each of these 125 largest German Companies.  BioNTech's Income Statement amounts in EUROs were from its US SEC 20-F Annual Report filings.


Thursday, April 14, 2022

The Five Largest German Auto and Truck Companies Generated Total Bottom-Line Earnings in Annual 2021 Which Increased By 143% From That in Annual 2020, and Which Increased By 66% From That in the Pre-Covid Pandemic Year of 2019.

From a review of companiesmarketcap.com and the Google Finance website, there were 5 German Auto and Truck Manufacturing Companies with stock market caps above US$ 20 bil recently.

From their Income Statement summaries reported in the WSJ Markets website, the table below shows the Consolidated Net Income (Loss) from continuing operations for annual years 2021, 2020 and 2019 for each of these 5 largest German Auto and Truck Companies.


Wednesday, April 13, 2022

Russia's Largest 15 Companies Generated Total Bottom-Line Earnings of Russian Rubles 6.015 Trillion ($70.5 Bil in US$s) in 2021, an Increase of 23% From the Pre-Pandemic Year of 2019. But the US Largest 15 Companies Generated Total Bottom-Line Earnings of $562 bil in 2021, an Increase of 59% From the Pre-Pandemic Year of 2019, Which Was 2.6 Times the 23% Increase of the 15 Largest Russian Companies.

From a review of companiesmarketcap.com and the Google Finance website, there were 15 Russian Companies with stock market caps above US$1 bil recently which also reported their income statement summaries in the WSJ Markets website, in the yahoo finance website or in their 20-F annual reports filed with the US SEC for each of the most recent three years 2021, 2020 and 2019.

And from a review of company filings with the US SEC, companiesmarketcap.com, the Google Finance website and the finviz stock screener website, I identified the 15 largest US Companies by stock market cap.

From their financial statements filed with the US SEC or their income summaries reported in the WSJ Markets website or in the yahoo finance website, the table below shows the Consolidated Net Income (Loss) from continuing operations for annual fiscal years ended 2021, 2020 and 2019 for each of these 15 largest Russian Companies and 15 largest US Companies.


Russia's Largest Technology Company Yandex Was Flat-Out Crushed By Its Main US Technology Competitor Alphabet on the Bottom-Line Annual Earnings Growth Front ..... For 2021 vs 2020, Alphabet Up By 89% and Yandex Down By 160%, For 2021 vs 2019, Alphabet Up By 121% and Yandex Down By 215%, and For 2021 vs 2017, Alphabet Up 500% and Yandex Down By 234%

From a summary of Russia's largest Technology Company Yandex's income statements presented in WSJ Markets on the web, and from a review of Yandex US largest Technology competitor Alphabet's financial statements in its US SEC filings, the table below shows the Annual Consolidated Net Income (Loss) for both Companies for each of the five most recent years 2017 through 2021.


Tuesday, April 12, 2022

US Largest Bank JPMorgan Chase Consistently Outperformed Russia's Largest Bank Sberbank on the Bottom-Line Annual Earnings Growth Front ..... 2021 vs 2020 By 15% and 2021 vs 2017 By 34%

From a review of US largest Bank JPMorgan Chase's financial statements in its US SEC filings and from a summary of Russia's largest Bank Sberbank's income statements presented in WSJ Markets on the web, the table below shows the Annual Consolidated Net Income for both Companies for each of the five most recent years 2017 through 2021.


Thursday, April 7, 2022

Russia Largest Oil & Gas Companies' Total Pretax Earnings Have Substantially Underperformed Those in Both the US and Europe Since the Pre-Covid Pandemic Year of 2019 ..... With the US Increasing by 85% Led by Chevron's +291%, Europe Increasing by 65% Led by Norway's Equinor's +240%, and Russia Increasing by Only 2%.

From a review of companiesmarketcap.com and the Google Finance website, there were four Russian Oil & Gas Companies with stock market caps above US$10 bil recently.

And from a review of company filings with the SEC, companiesmarketcap.com, the Google Finance website and the finviz stock screener website, I identified the four largest US Oil & Gas Companies and also the four largest European Oil & Gas Companies, both by stock market cap.

From their financial statements filed with the US SEC or their financial statements included in their Companies' investor relations website, the table below shows the Pretax Income (Loss) From Continuing Operations for annual 2021, 2020 and 2019 for each of these 12 Oil & Gas-Related Companies.


Wednesday, April 6, 2022

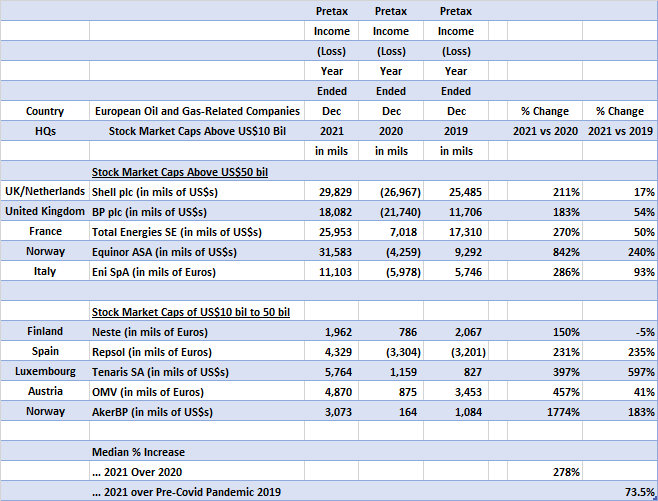
The Ten Largest European Oil & Gas-Related Companies All Reported Outstanding Annual 2021 Earnings ..... Median % Increase For 2021 Over 2020 Was 278% and For 2021 Over Pre-Covid Pandemic 2019 Was 73.5% ..... The Two Norwegian Oil & Gas Companies (Equinor and AkerBP) Both Had Spectacular Annual 2021 Earnings.

From a review of company filings with the SEC, companiesmarketcap.com, the Google Finance website and the finviz stock screener website, there were 5 European Oil & Gas-Related Companies with stock market caps above US$50 bil very recently.

And from a review of company filings with the SEC, companiesmarketcap.com, the Google Finance website and the finviz stock screener website, there were 5 European Oil & Gas-Related Companies with stock market caps of between US$10 bil and 50 bil very recently. 

From their financial statements filed with the US SEC or their financial statements included in their Companies' investor relations website, the table below shows the Audited Pretax Income (Loss) From Continuing Operations for annual 2021, 2020 and 2019 for each of these 10 largest European Oil & Gas-Related Companies.


Monday, April 4, 2022

The 24 Canada Oil & Gas Companies With Stock Market Caps Above $1 Bil Generated Annual 2021 Total Pretax Income That Was Up 1,579% From Annual 2020, 8.3 Times the 191% Increase in the 2021 vs 2020 Total Pretax Income of the 54 US Oil & Gas Cos With Stock Market Caps Above $5 Bil.

From a review of company filings with the SEC, companiesmarketcap.com, the Google Finance website and the finviz stock screener website, there were 25 Canadian Oil & Gas Companies with stock market caps above $1 bil very recently.

Twenty four of these 25 Companies reported their 2021 and 2020 financial statements in Canadian dollars. 

From their financial statements filed with the US SEC or their financial statements included in their Companies' investor relations website, the table below shows the Pretax Income (Loss) From Continuing Operations for annual 2021 and 2020 for each of these 24 largest Canadian Oil & Gas Companies.


Sunday, April 3, 2022

The 54 US Oil & Gas Companies With Stock Market Caps Above $5 Bil Dec 2021 Quarter Total Pretax Earnings Increased by 350% From the Dec 2020 Quarter. For Annual 2021, These 54 Companies' Total Pretax Earnings Increased By $288.6 Bil From Annual 2020.

From a review of company filings with the SEC, the Google Finance website and the finviz stock screener website, there were 54 US Oil & Gas Companies with stock market caps above $5 bil very recently.

The table below shows the gold-standard US GAAP Pretax Income (Loss) From Continuing Operations for the fourth quarters of 2021 and 2020 and for annual 2021 and 2020 for each of these 54 largest US Oil & Gas Companies.